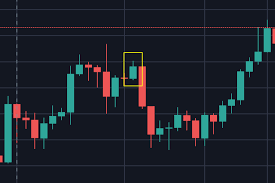
There are several ways to interpret cryptocurrency charts. Generally, the standard cryptocurrency chart shows volume. Volume represents the total trading activity of a given cryptocurrency during the time period that you choose. The longer the volume bar, the more buying pressure there is. Green volume bars indicate an increased interest in the coin. Conversely, red volume bars indicate selling pressure. The following table describes the most common indicators of a cryptocurrency’s market value. Understanding how to interpret crypto charts is essential for successful trading.
Candlesticks
There are a few ways to read a candlestick chart. While the most common use of this technical tool is to predict trends, general momentum, and price direction, candlestick patterns also provide valuable context to other data and indicators. You can read a hammer candlestick, for example, by examining the length of its lower wick and the size of its body. The candlestick may be green or red in color.
The body of a candle is the most visible part. It represents the range of the open and closing prices for a certain timeframe. Depending on which charting tool you use, the body of a candle will be green or red. A red candle indicates a lower price and a green one shows a higher price. You can compare these two types of charts to see which one is more likely to predict the price of your chosen asset.
Moving averages
One of the most common indicators to use on your cryptocurrency charts is the moving average. Moving averages smooth out price movements by taking into account the price movements over a certain period of time. For example, a 21-period moving average smooths out price movements using the last 21 days of data. You can choose to use different time frames to determine the best time frame for you. If you are using a daily chart, a longer period may be appropriate.
The moving average can also be used to determine if a trend is starting or is already underway. The trend begins when the price breaks one or both MAs. If the 50 MA is broken, the trend continues to move higher. If both MAs are broken, the trend starts accelerating. However, the second MA acts as a support and resistance, so a trader must use both indicators in order to determine which trend to follow.
Volume
There are several indicators that can help you understand the trend of a cryptocurrency. One of these is the Volume. This indicator measures the volume of buying and selling pressure over a period of time. It moves between zero and one hundred, and if the indicator rises or falls above a certain threshold, it signals a possible change in trend. This indicator is generally used as a secondary indicator. The trend is an important part of a cryptocurrency’s price action, and you can use it to determine whether a certain cryptocurrency is on the verge of going up or down.
Another indicator is the volume of trades. This measure reveals how many coins are being traded. When there is a large volume of trading, this shows that interest in a specific currency is high. If there is a small volume of trading, this means that the price of the cryptocurrency will likely go down. If the volume of trading is low, however, it indicates that there is very little interest in the currency and will likely not move much. In general, the higher the volume of BTC exchange, the less volatile a cryptocurrency’s price is likely to be.
Also read ifvod
Supports and resistance levels
There are a few ways to identify supports and resistance levels on crypto charts, and they are particularly useful in automated trading. A technical indicator, such as a moving average, can help you identify these levels. Using a trendline indicator can also help you identify key price levels. However, you should remember that this method is not foolproof, and false indications are likely to occur. Therefore, it is important to know the correct time to set up automated trading.
The key to identifying these levels is knowing when to buy and sell. While prices usually move in a range, if a price breaks out of the range, it is considered a sign of a bearish trend. During an uptrend, investors should buy slightly above support and sell near resistance. In a downtrend, sellers should wait until the price has broken through support. Once a trend has been confirmed, you can use this information to place your trades.
Also know about Essentials hoodie

